


The Performance Budget and Root Causes of Jank
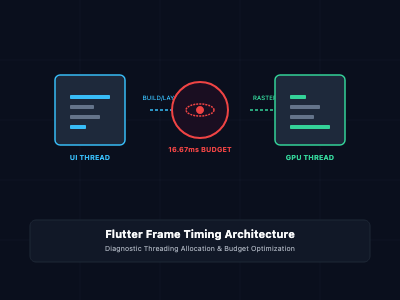
To maintain a smooth user experience, mobile applications target rendering speeds of 60 frames per second (fps), which drops the rendering budget for a single frame to 16.67 milliseconds. On modern flagship devices hosting 120Hz displays, this rendering budget shrinks even further to 8.33 milliseconds per frame. When the application pipeline exceeds this budget, frames are dropped, manifesting as visible stutters, hitches, and freezes—collectively known as "jank."
In Flutter, profiling and diagnosing performance degradation requires understanding the underlying threading architecture. Jank typically originates from one of two distinct execution paths:
- UI Thread Bottlenecks: The Dart Virtual Machine (VM) executing your application logic is overworked. This includes running complex widget layouts, executing heavy synchronous math operations, or parsing massive JSON payloads on the main isolate.
- Raster Thread Bottlenecks: The graphics processing unit (GPU) thread is struggling to composite your layout. This is commonly triggered by expensive visual layers, excess clip paths, offscreen buffer allocations (such as unchecked saveLayer operations), and unoptimized image decoding.
To build responsive interfaces, developers must move away from guessing bottlenecks and instead establish reproducible, data-driven profiling workflows.
Setting Up the Profiling Environment Correctly
An essential rule of performance optimization is to never profile applications in debug mode. Debug mode introduces significant VM overhead—including assertion checks, hot-reload infrastructure, verbose logging, and just-in-time (JIT) compilation. Timings recorded in debug mode show phantom issues that do not exist in production, while hiding real, compile-time performance characteristics.
Always profile on a physical, low-end device running in profile mode. Profile mode compiles Dart ahead-of-time (AOT) to native machine instructions, matching production performance while preserving VM service extensions for DevTools connection.
# Verify connected physical devices
flutter devices

# Launch the application on a target physical device in profile mode
flutter run --profile -d <device-id>
Core Profiling Workflows with DevTools
Once the application is running in profile mode, launch Flutter DevTools from your IDE command palette or terminal and navigate to the Performance view.
1. Performance View (Analyzing the Frame Timeline)
The Frame Rendering Chart provides a real-time visualization of your application's frame timeline. Each vertical bar represents a single rendered frame, split into two segments:
- The top segment (blue) indicates the time spent on the UI thread (building, laying out, and painting widgets in Dart).
- The bottom segment (green/orange) indicates the time spent on the Raster thread (GPU processing).
Frames exceeding the target threshold (16.67ms) are highlighted in red. Clicking a janky frame allows you to isolate which thread breached the frame budget.
2. CPU Profiler (Tracing Main Isolate Blockers)
If the UI thread is the bottleneck, switch to the CPU Profiler tab in DevTools:
- Click Record to start tracking.
- Interact with the application to reproduce the jank (e.g., scroll a list or trigger a navigation).
- Click Stop to construct the call tree and flame chart.
Look for functions with high Self Time (the time spent executing code inside that specific function, excluding external helper calls). A high Self Time indicates a complex synchronous block that must be optimized or offloaded.
3. Flutter Inspector (Pruning Rebuild Loops)
Unnecessary widget rebuilds are a primary cause of UI thread starvation. In the DevTools Inspector tab, enable Track widget build counts. As you interact with the app, watch the build counts next to each widget. If widgets containing static text or secondary images are rebuilding during a simple count update, your state management architecture is triggering wasteful operations.
Common Architectural Fixes and Code Demos
Offloading Heavy JSON Parsing with Isolate.run
Parsing raw JSON strings synchronously blocks the main Dart isolate, dropping multiple frames. By using Isolate.run(), you offload serialization tasks to a separate worker thread, copying only the final typed objects back to the main thread.
// Unoptimized: Synchronous parsing blocks the main isolate UI thread
Future<List<UserRecord>> fetchAndParseUsers(String rawJson) async {
  final List<dynamic> decoded = jsonDecode(rawJson);
  return decoded.map((json) => UserRecord.fromJson(json)).toList();
}

// Optimized: Offloading parsing to a separate worker isolate
import 'dart:convert';
import 'dart:developer';
import 'package:flutter/foundation.dart';

Future<List<UserRecord>> fetchAndParseUsersOptimized(String rawJson) async {
  // Isolate.run executes the computation on a separate helper thread
  return await Isolate.run(() {
    final List<dynamic> decoded = jsonDecode(rawJson);
    return decoded.map((json) => UserRecord.fromJson(json)).toList();
  });
}
Optimizing Stateful Subtrees to Eliminate Rebuilds
Rebuilding an entire page to update a single variable ruins rendering times. You should isolate state changes inside dedicated, localized state management builders or extract the stateful component into its own widget.
// Unoptimized: Rebuilding the entire tree on every state update
class BadCounterScreen extends StatefulWidget {
  const BadCounterScreen({super.key});

  @override
  State<BadCounterScreen> createState() => _BadCounterScreenState();
}

class _BadCounterScreenState extends State<BadCounterScreen> {
  int _counter = 0;

  @override
  Widget build(BuildContext context) {
    return Scaffold(
      body: Column(
        children: [
          const HighComplexityStaticLayout(), // Rebuilds unnecessarily
          Text('Count value is: $_counter'),
          ElevatedButton(
            onPressed: () => setState(() => _counter++),
            child: const Text('Increment'),
          ),
        ],
      ),
    );
  }
}

// Optimized: Isolate rebuilding inside a modular widget
class GoodCounterScreen extends StatelessWidget {
  const GoodCounterScreen({super.key});

  @override
  Widget build(BuildContext context) {
    return const Scaffold(
      body: Column(
        children: [
          HighComplexityStaticLayout(), // Now remains static
          CounterValueWidget(), // Only this widget rebuilds
        ],
      ),
    );
  }
}

class CounterValueWidget extends StatefulWidget {
  const CounterValueWidget({super.key});

  @override
  State<CounterValueWidget> createState() => _CounterValueWidgetState();
}

class _CounterValueWidgetState extends State<CounterValueWidget> {
  int _counter = 0;

  @override
  Widget build(BuildContext context) {
    return Column(
      children: [
        Text('Count value is: $_counter'),
        ElevatedButton(
          onPressed: () => setState(() => _counter++),
          child: const Text('Increment'),
        ),
      ],
    );
  }
}
SRE Verification and Regression Testing
To ensure that your performance optimizations are successful and do not degrade over future release cycles, adopt a strict verification workflow:
- Verify Under Identical Conditions: Always measure frame times before and after your changes on the same physical device, keeping background system activities constant.
- Implement Performance Budgets in CI: Use Flutter integration tests alongside the flutter_driver library to automate frame-duration checks. Assert that average frame build times remain below 8ms during code evaluation.
- Analyze Binary Footprint: Run flutter build apk --analyze-size or use the DevTools App Size Tool to ensure optimization libraries do not introduce binary size regressions.