The Limitations of Headless Testing
While headless browser testing with automated scripts is highly effective for clean-room CI/CD pipelines, it is a difficult workflow for local debugging and exploratory testing. Developers frequently run into the following limitations:
- Invisible State Failures: When a headless script fails to click a hidden element or gets stuck behind a security banner, finding the root cause is difficult without a live viewport.
- Complex Authentication State: Headless browsers cannot easily maintain persistent sessions, forcing developers to write complex authentication handling scripts for every single test run.
- Lack of Interactive Control: If an automated script fails due to an unexpected layout shift, you cannot pause the runner, manually correct the viewport, and instruct the agent to continue.
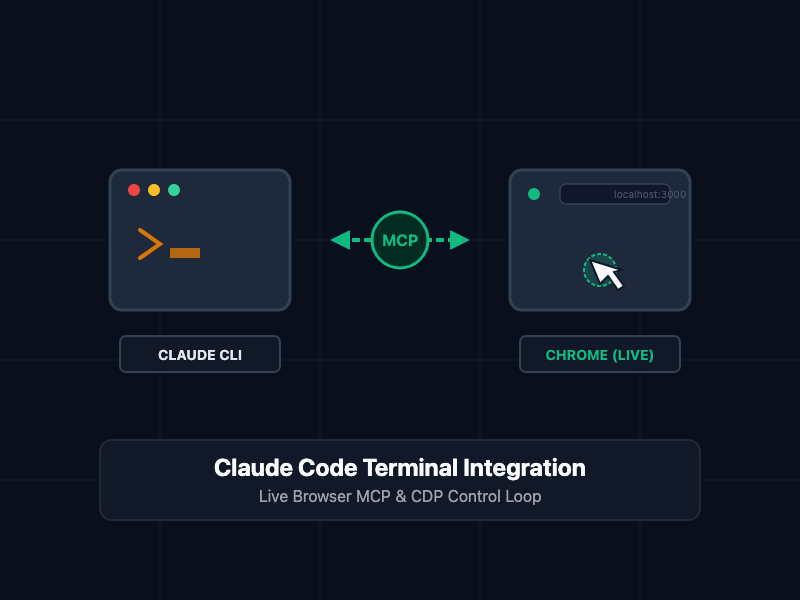
By utilizing the Model Context Protocol (MCP), Claude Code can connect directly to a running, visible instance of Google Chrome on your host machine. Instead of executing isolated headless code, Claude acts as an interactive browser operator—executing commands, clicking buttons, submitting forms, and taking screenshots of the real window you are watching on your desktop.
Understanding the Browser MCP Architecture
The Model Context Protocol (MCP) is an open standard that allows client applications (such as Claude Code) to securely invoke tools provided by local or remote servers.
Under this architecture:
- The Host Browser: You launch Google Chrome with remote debugging enabled over a specific port.
- The MCP Server: A localized process (such as @modelcontextprotocol/server-playwright or a Puppeteer-based equivalent) runs on your machine and attaches to the Chrome instance via Chrome DevTools Protocol (CDP).
- The LLM Client: Claude Code reads the schema of available tools exposed by the MCP server (such as browser_navigate, browser_click, and browser_screenshot) and executes them directly in response to your terminal commands.
This allows Claude Code to operate the browser with zero custom script writing. You simply ask Claude to do the work, and the agent translates your instructions into real-time clicks and form entries on your screen.
Core Concepts
1. Configuring the Chrome Remote Debugging Port
To allow the MCP server to control your active web browser rather than spinning up a blank, headless sandbox, you must launch Chrome with the remote debugging flag enabled.
Launching Chrome via CLI
# On macOS
/Applications/Google\ Chrome.app/Contents/MacOS/Google\ Chrome --remote-debugging-port=9222 --user-data-dir=~/ChromeProfileSRE

# On Windows
start chrome.exe --remote-debugging-port=9222 --user-data-dir=%LOCALAPPDATA%\ChromeProfileSRE

# On Linux
google-chrome --remote-debugging-port=9222 --user-data-dir=~/.config/ChromeProfileSRE
2. Registering the Browser MCP Server
Once Chrome is running and listening on port 9222, register the MCP server inside your Claude Code configuration. This allows Claude to discover the browser automation tools on startup.
Configuration Template: ~/.claude/settings.json
{
  "mcpServers": {
    "browser-control": {
      "command": "npx",
      "args": [
        "-y",
        "@modelcontextprotocol/server-playwright"
      ],
      "env": {
        "CDP_PORT": "9222"
      }
    }
  }
}
The Interactive Debugging Workflow
With the MCP server configured, you can command Claude Code to interact with the web browser using natural language. The workflow for troubleshooting local development bugs operates as a collaborative, real-time loop:
Step 1: Navigating and Inspecting the DOM
You ask Claude Code to inspect the active interface of your application. Claude connects through the CDP connection, navigates to the page, and retrieves the structural DOM.
User: claude "Open localhost:3000, inspect the navigation bar, and tell me why the login button is unaligned."
Step 2: Triggering Actions and Verifying Behavior
Claude identifies the target selector and issues click or typing actions directly in your active browser window. You watch the form input fill out, the submission occur, and any errors populate.
User: claude "Fill out the registration form with test parameters, click submit, and tell me if the error banner appears."
Step 3: Capturing Viewport Screenshots to Diagnose Layout Errors
If a styling error or network exception occurs during the interaction, Claude uses the screenshot capability to capture a visual rendering of the screen, analyzing layout parameters that are invisible to raw HTML parsers.
User: claude "The submission seems to fail silently. Take a viewport screenshot, analyze the visual state, and inspect the console logs."
Best Practices
- Isolate Your Profiles: Always launch Chrome with a dedicated --user-data-dir flag when exposing CDP ports. This prevents the MCP server from accessing your personal extensions, autofill data, or sensitive session cookies.
- Bind to Localhost Only: Ensure your debugging port is bound to 127.0.0.1 and never exposed on public network interfaces to prevent remote exploitation.
- Use High-Density Selectors: When asking Claude Code to interact with elements, use standard, immutable DOM selectors (such as data-testid or unique IDs) rather than fragile CSS hierarchies to prevent tool-execution failures during site refactors.
- Review and Monitor Actions: Because Claude is manipulating a real browser window, monitor the actions in real-time. If Claude gets stuck on an infinite loading spinner or is repeatedly attempting to click an unresponsive element, cancel the prompt execution using Ctrl+C.
Getting Started
To implement this workflow, launch Chrome with remote debugging, verify that your port is listening, configure your settings file, and run Claude Code to start your first interactive web-debugging session.
# Step 1: Launch Google Chrome with remote debugging active
/Applications/Google\ Chrome.app/Contents/MacOS/Google\ Chrome --remote-debugging-port=9222 --user-data-dir=~/SREDevProfile &

# Step 2: Verify the debugging port is listening
curl [http://127.0.0.1:9222/json/version](http://127.0.0.1:9222/json/version)

# Step 3: Initialize Claude Code
claude

# Step 4: Instruct Claude to verify your local interface
claude "Connect to the running Chrome instance, open localhost:3000, take a screenshot to confirm rendering, and click the dashboard link."
By linking your local CLI agent directly to an active browser window via Model Context Protocol, you convert manual, slow visual testing cycles into an automated, highly-observable debugging process.