

The Failure of Traditional Logging in Microservices
In monolithic architectures, searching through server logs using grep or basic text search was a straightforward way to diagnose bugs. However, as applications scale into distributed microservices running across multi-node clusters, traditional logging patterns create severe operational friction:
- Context Fragmentation: A single user request frequently fans out across dozens of internal microservices, databases, and third-party APIs. When each service emits 10 to 20 isolated log lines per request, correlating a failure across millions of log streams requires complex string searching and manual timeline alignment.
- Log Volume Explosion: High-throughput applications processing 10,000 requests per second can generate hundreds of thousands of log lines per second. Most of these lines record routine, successful steps, inflating ingestion costs and storage overhead without offering actionable debugging value.
- Low Dimensionality and Cardinality: Standard log statements (logger.info("Payment processing started")) lack essential business and infrastructure context. Without high-cardinality identifiers (such as user_id, tenant_id, cart_value, or feature_flags), engineers cannot filter telemetry by specific user cohorts or execution states.
- Passive Delivery Mechanisms: Relying solely on OpenTelemetry (OTel) protocols or structured JSON formatters does not fix underlying instrumentation logic. Standardizing garbage log lines into JSON key-value pairs merely produces standardized noise.
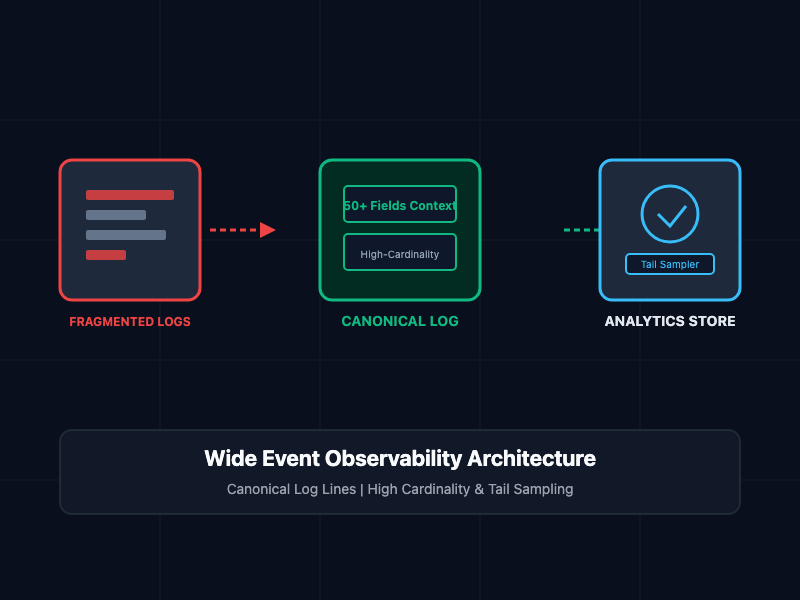
Transitioning from scattered log statements to Wide Events (also known as Canonical Log Lines) resolves these liabilities by consolidating all request metadata into a single, high-cardinality record emitted per service.
What Are Wide Events and Canonical Log Lines?
Popularized by engineering organizations like Stripe, a Canonical Log Line (or Wide Event) is a single, context-rich telemetry payload emitted at the end of a request lifecycle for a given service.
Instead of emitting multiple log statements throughout a function's execution path, the application initializes an in-memory event context object when a request arrives. As the request moves through handlers, middleware, and database adapters, business attributes, performance metrics, and error traces are attached to this context object.
When the HTTP response is completed, the service emits exactly one wide event containing 50+ high-cardinality fields.
Key Observability Definitions
- High Cardinality: Data fields containing millions of unique values (e.g., user_id, order_id, session_token). High cardinality is essential for pinning down specific user incidents.
- High Dimensionality: Events containing dozens or hundreds of key-value attributes. High dimensionality allows engineers to answer unanticipated questions during live outages.
- Tail Sampling: The practice of evaluating whether to keep or drop a telemetry record after the request completes, based on its final outcome (e.g., status codes, latency thresholds, or account tiers).
Core Concepts and Implementation
1. Accumulating Wide Events in Node.js / Express
To implement wide events without refactoring business logic across every controller, attach an event accumulator to the request context using Express middleware.
The following Node.js script demonstrates how to initialize a request-scoped event buffer, attach high-cardinality fields during lifecycle execution, and emit a single Canonical Log Line upon request completion:
// middleware/wideEvent.js - Wide Event Accumulator Middleware
import { v4 as uuidv4 } from 'crypto';

export function wideEventMiddleware(req, res, next) {
  const startTime = process.hrtime.bigint();

  // 1. Initialize the Wide Event context on the request object
  req.wideEvent = {
    // Infrastructure & Routing Context
    trace_id: req.headers['x-trace-id'] || uuidv4(),
    service_name: 'payment-gateway',
    environment: process.env.NODE_ENV || 'production',
    http_method: req.method,
    http_path: req.path,
    client_ip: req.ip || req.headers['x-forwarded-for'],
    user_agent: req.headers['user-agent'],

    // Initialized Business / User Context (To be populated by handlers)
    user_id: null,
    tenant_id: null,
    subscription_tier: null,
    feature_flags: [],

    // Performance & Execution Counters
    db_query_count: 0,
    db_time_ms: 0,
    cache_hit: false,

    // Error State Context
    error_type: null,
    error_message: null,
    stack_trace: null
  };

  // 2. Intercept response completion to finalize and emit the Canonical Log Line
  res.on('finish', () => {
    const endTime = process.hrtime.bigint();
    const durationNs = endTime - startTime;

    // Calculate final duration in milliseconds
    req.wideEvent.duration_ms = Number(durationNs) / 1e6;
    req.wideEvent.status_code = res.statusCode;
    req.wideEvent.is_error = res.statusCode >= 400;

    // Emit the authoritative Canonical Log Line as a single JSON string
    console.log(JSON.stringify(req.wideEvent));
  });

  next();
}

// Controller usage example demonstrating context enrichment
export async function handlePayment(req, res) {
  // Enrich the Wide Event with high-cardinality business fields
  req.wideEvent.user_id = req.user.id;
  req.wideEvent.tenant_id = req.user.tenantId;
  req.wideEvent.subscription_tier = req.user.plan;
  req.wideEvent.cart_value_usd = req.body.amount;

  try {
    // Database operation simulation
    req.wideEvent.db_query_count += 1;
    req.wideEvent.cache_hit = true;

    res.status(200).json({ status: 'success', transactionId: 'tx_99218' });
  } catch (err) {
    // Attach error context directly into the single Wide Event
    req.wideEvent.error_type = err.name;
    req.wideEvent.error_message = err.message;
    req.wideEvent.stack_trace = err.stack;

    res.status(500).json({ error: 'Internal Payment Failure' });
  }
}
2. Implementing Tail Sampling Rules
Emitting a 50-field Wide Event for every request provides complete visibility, but storing 100% of successful, fast requests in high-volume environments can inflate storage costs. Tail Sampling solves this by evaluating the completed Wide Event and deciding whether to retain or drop it.
The following Python snippet illustrates a deterministic Tail Sampling evaluation processor:
# tail_sampler.py - Rule-Based Telemetry Sampler Engine
import random
from typing import Dict, Any, Tuple

class TailSampler:
    def __init__(self, p99_latency_threshold_ms: float = 500.0, random_sample_rate: float = 0.02):
        self.p99_latency_threshold_ms = p99_latency_threshold_ms
        self.random_sample_rate = random_sample_rate

    def should_retain_event(self, event: Dict[str, Any]) -> Tuple[bool, str]:
        """
        Evaluates completed Wide Events to determine storage retention based on outcome.
        """
        # Rule 1: Always retain 100% of HTTP errors, 5xx server failures, and exceptions
        if event.get("is_error") or event.get("status_code", 200) >= 400:
            return True, "ALWAYS_KEEP_ERROR"

        # Rule 2: Always retain slow requests exceeding p99 latency SLAs
        if event.get("duration_ms", 0) >= self.p99_latency_threshold_ms:
            return True, "ALWAYS_KEEP_SLOW_REQUEST"

        # Rule 3: Always retain high-priority VIP customer or internal test account events
        if event.get("subscription_tier") in ["enterprise", "vip_tier"]:
            return True, "ALWAYS_KEEP_VIP"

        # Rule 4: Apply low-percentage random sampling to remaining healthy, fast requests
        if random.random() < self.random_sample_rate:
            return True, "RANDOM_SAMPLE_HEALTHY"

        # Drop the event to reduce telemetry storage bill
        return False, "DROP_HEALTHY_FAST"

# Execution Example
# sampler = TailSampler(p99_latency_threshold_ms=350.0, random_sample_rate=0.05)
# keep_event, reason = sampler.should_retain_event(sample_wide_event)
# if keep_event:
#     store_in_clickhouse_or_elasticsearch(sample_wide_event)
Comparative Analysis: Traditional Logs vs. Wide Events
| Dimension | Traditional Distributed Logs | Wide Events / Canonical Log Lines |
| Event Volume | 10–20 log lines per service per request | Exactly 1 structured event per service per request |
| Cardinality | Low (Mostly string messages) | Extremely High (user_id, order_id, trace_id) |
| Dimensionality | Low (3–5 key-value pairs) | High (50+ key-value pairs) |
| Debugging Method | Text search across interleaved lines | Analytics-style SQL queries over structured events |
| Sampling Strategy | Head sampling (Dropping logs upfront) | Tail sampling (Sampling based on request outcome) |
| Storage Overhead | High noise-to-signal ratio | Low noise, high-density structured datasets |
SRE and Observability Best Practices
- Unify Tracing with Canonical Lines: Include your distributed tracing IDs (trace_id and span_id) inside every Wide Event to easily jump from an analytical SQL query directly into a full trace graph.
- Avoid Emitting Mid-Request String Logs: Discourage developers from writing console.log() or logger.info() inside loop bodies or utility functions. Require all context to be appended to the request-scoped event context instead.
- Index Columns Columnar Storage Engines: Store Wide Events in columnar analytical databases (such as ClickHouse, Apache Doris, or DuckDB) to run lightning-fast aggregations across high-cardinality fields without scanning full JSON payloads.
- Audit Business Context Regularly: Review Wide Event schemas quarterly with product and SRE teams to ensure crucial attributes—such as feature flag states, deployment SHAs, and user tiers—remain populated.
Getting Started
To transition your system from fragmented logging to Wide Events:
# Step 1: Install UUID generation and async storage utilities
npm install crypto uuid

# Step 2: Register the wideEventMiddleware at the root of your service stack
# app.use(wideEventMiddleware);

# Step 3: Configure your log collector (e.g., Vector or FluentBit) to forward events
# to a columnar analytics engine for fast SQL querying.
By consolidating telemetry into high-cardinality Wide Events paired with Tail Sampling, engineering teams eliminate log noise, cut observability costs, and debug complex production incidents in minutes rather than hours.