


Google Looker: A Unified Approach to Business Intelligence
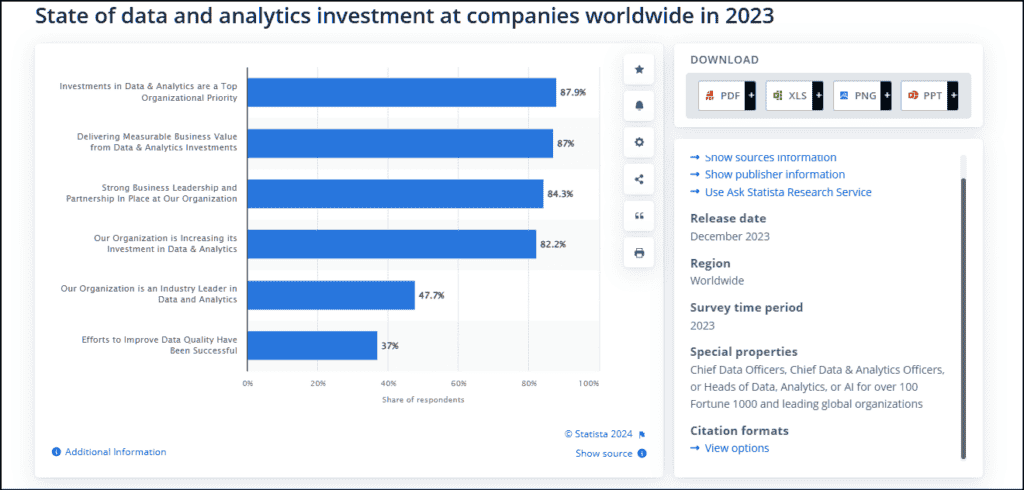
The business intelligence (BI) market is growing unprecedentedly and is expected to cross USD 34 billion by 2028. According to a Statista report, investment in data and analytics is a top priority for over 87% of Chief Data Officers, Chief Data & Analytics Officers, and Heads of Data, Analytics, or AI. This is all very natural, as business intelligence is now a matter of strategic necessity and competitive differentiation.
At the end of the day, understanding all the data that your business generates is the only way to put it ahead of the competition. However, the challenge lies in making data insights accessible to a broader audience within the organization, regardless of their technical expertise.
This is where Google Cloud’s Looker comes into play. Looker is a comprehensive data platform that combines data visualization with data modeling, exploration, and analytics capabilities. It offers a unified approach to business intelligence (BI) that democratizes data insights. Let’s explore how Looker empowers organizations to break down the dependencies and barriers that often exist between data analysts and decision-makers.
How Does Looker Handle Data?
Looker uses a universal semantic modeling layer. This layer offers a centralized location for governing and curating essential business metrics.
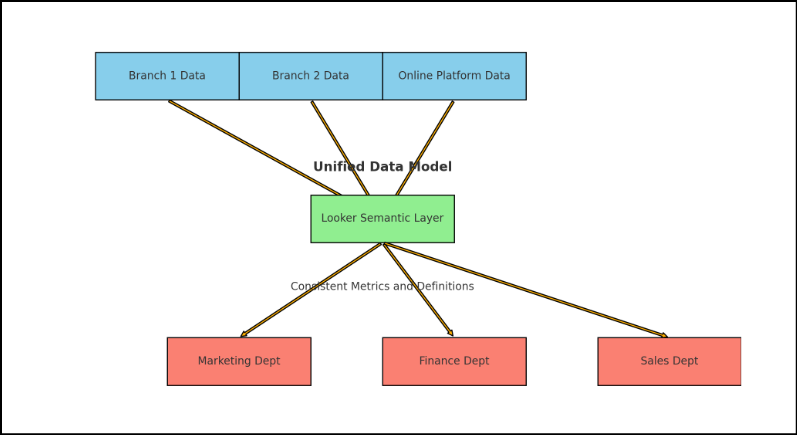
Consider a global retail company with multiple branches and online platforms without a unified data model. Different departments may pull data from various sources, each with its own format and update schedule, leading to discrepancies in the figures. They might have different definitions or calculations for key metrics like “sales,” “revenue,” or “profit,” resulting in varied interpretations of the same data. Data silos can cause departments to have access to only a subset of the overall data, leading to incomplete or skewed data analysis.
Looker’s semantic layer solves this by standardizing metrics so everyone from the marketing team to the finance department sees the exact figures across the same parameters, leading to more cohesive decision-making.
Looker’s modeling layer also guarantees that information flows seamlessly across various tools and applications. For example, a multinational corporation can integrate data from multiple ERP and CRM systems while ensuring that executives have a comprehensive view of operations without data silos using Looker.
How Can Businesses Use Looker to Act on the Data?
Looker provides several capabilities that allow businesses to take action and operationalize their data directly within the platform.
• Alerts and Notifications
Looker allows users to set up data alerts and notifications based on specific conditions or thresholds defined in their data models or dashboards. These alerts can be configured to trigger emails, Slack messages, or other notifications when certain events occur or data falls outside of expected ranges. This enables businesses to proactively monitor key metrics and take immediate action when anomalies or critical situations arise.
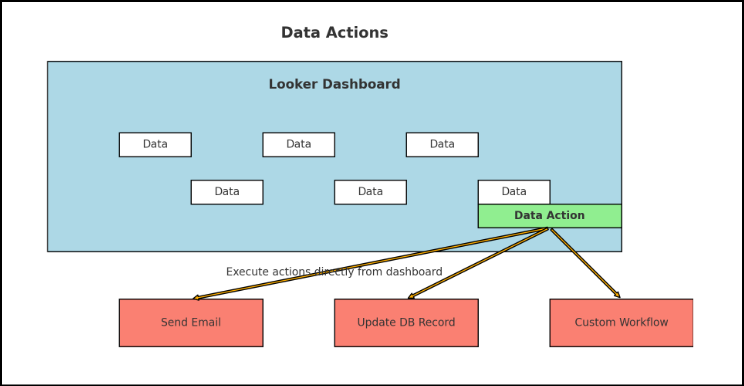
• Data Actions
Users can create custom actions that can be executed directly from a dashboard or exploration. These actions can be simple tasks like sending an email or updating a record in a database or more complex workflows involving third-party integrations or custom code. For example, a user could create a Data Action to update a customer’s status in a CRM system based on their behavior data displayed in a Looker dashboard.
• Integration with Third-Party Applications
Looker offers robust APIs and integration capabilities, allowing businesses to seamlessly integrate Looker with other applications and systems within their technology stack. For example, Looker can be integrated with marketing automation platforms, enabling enterprises to trigger campaigns or personalized messaging based on customer data and insights discovered in Looker. Similarly, Looker can be integrated with business process management tools or workflow automation platforms to trigger specific actions or processes based on data conditions.
• Scheduling and Data Delivery
Looker allows businesses to operationalize their data workflows. Users can schedule recurring data extracts, reports, or dashboards to be generated and delivered via email, integrated content management systems, or other destinations. Without manual intervention, this capability enables businesses to streamline data-driven processes, such as regular reporting or data-driven email campaigns.
• Embedded Analytics and Custom Applications
Looker’s embedded data analysis capabilities enable businesses to directly incorporate interactive data experiences into their applications or customer-facing platforms. By embedding Looker dashboards, explorations, or custom-built data applications, companies can empower their users or customers to explore data, uncover insights, and take action within the context of their primary applications.
Use Cases: What Can Businesses Achieve with Looker?
1. Optimizing Inventory Management in eCommerce
Consider a multi-channel retail company facing challenges with maintaining optimal inventory levels across its various stores and online platforms. The company would need a way to better understand sales patterns and stock levels to ensure that inventory is efficiently managed across all channels.
The Looker tool can be used to-
- Integrate data from inventory systems, supply chain systems, POS systems, online sales platforms, and warehouse management systems
- Standardize metrics and definitions across all data sources
- Create custom dashboards that visualize real-time inventory levels, sales trends, and supply chain performance
- Customize these dashboards for different user roles, such as store managers, regional managers, and supply chain analysts
- Utilize Looker’s advanced analytics capabilities to build predictive models that forecast future sales trends based on historical data
- Use this information to anticipate demand and adjust inventory levels proactively
- Set up data alerts to notify managers when inventory levels fall below or exceed predefined thresholds so they can quickly respond to potential stock issues
2. Enhancing Customer Segmentation in Finance
Consider a regional bank that aims to offer more personalized services and products but faces challenges because its data is siloed across different departments. The bank is finding it difficult to get a comprehensive view of customer behavior and preferences.
They can use Looker to-
- Integrate customer data from multiple sources, including transaction systems, customer service databases, and web analytics platforms
- Create a semantic layer so all departments use the same definitions and calculations for key metrics like customer value, engagement, and behavior patterns
- Build custom dashboards tailored for different roles within the bank, such as marketing, customer service, and product development teams
- Perform deep dives into customer data, identifying trends and patterns that were previously hidden, forecast customer behavior, and identify opportunities for cross-selling and upselling
- Use these insights to develop detailed customer personas and deliver personalized marketing campaigns
3. Improving Patient Care Coordination in Healthcare
For a large hospital network, coordinating patient care across multiple facilities and ensuring consistent treatment protocols can be difficult if the data isn’t integrated. They won’t be able to access comprehensive patient information, leading to inconsistencies in care and treatment.
Here, Looker can help in the following ways-
- Consolidate data from electronic health records (EHRs), treatment plans, and operational systems into a single platform where all relevant patient and operational data are accessible
- Standardize medical terminologies and treatment protocols across all facilities
- Doctors, nurses, and administrative staff can use Looker’s data exploration tools to easily retrieve patient histories, treatment effectiveness data, and operational metrics in real-time
- Create comprehensive dashboards for tracking patient progress, treatment effectiveness, and resource utilization, customized for different roles, such as physicians, nurses, and hospital administrators
- Enable better tracking of patient progress and treatment outcomes
4. Enhancing Product Development for a Technology Company
A technology company trying to enhance its product development process will usually face challenges in managing and analyzing data generated from design, testing, and user feedback processes. However, this data is crucial to gain insights into product performance and user feedback.
Here is how Looker can be used to overcome this hurdle-
- Create a unified platform where all relevant data is accessible
- Define and document consistent business terms to be used by all involved teams
- Build custom dashboards to visualize data for different roles, such as product managers, engineers, and UX designers
- Build predictive models to identify potential issues early in the development cycle and to forecast product performance based on historical data
- Create feedback loops where user feedback data is continuously monitored and analyzed
- Use this insight to rapidly iterate on product features and address user concerns in real-time
5. Streamlining Production Processes in Manufacturing
Imagine an electronics manufacturer trying to streamline production processes to reduce downtime and improve efficiency. The manufacturer must integrate data from various production-related systems to achieve a unified view of operations.
The manufacturer can implement Looker to-
- Integrate data from production machines, supply chain systems, and quality control databases, offering a holistic view of the production process
- Looker’s semantic layer can be used to standardize production metrics and terminologies
- Develop real-time dashboards in Looker to monitor production line performance and note insights into production efficiency, identify bottlenecks, and track quality control issues
- Build predictive models that forecast potential production issues and optimize maintenance schedules according to the predictions
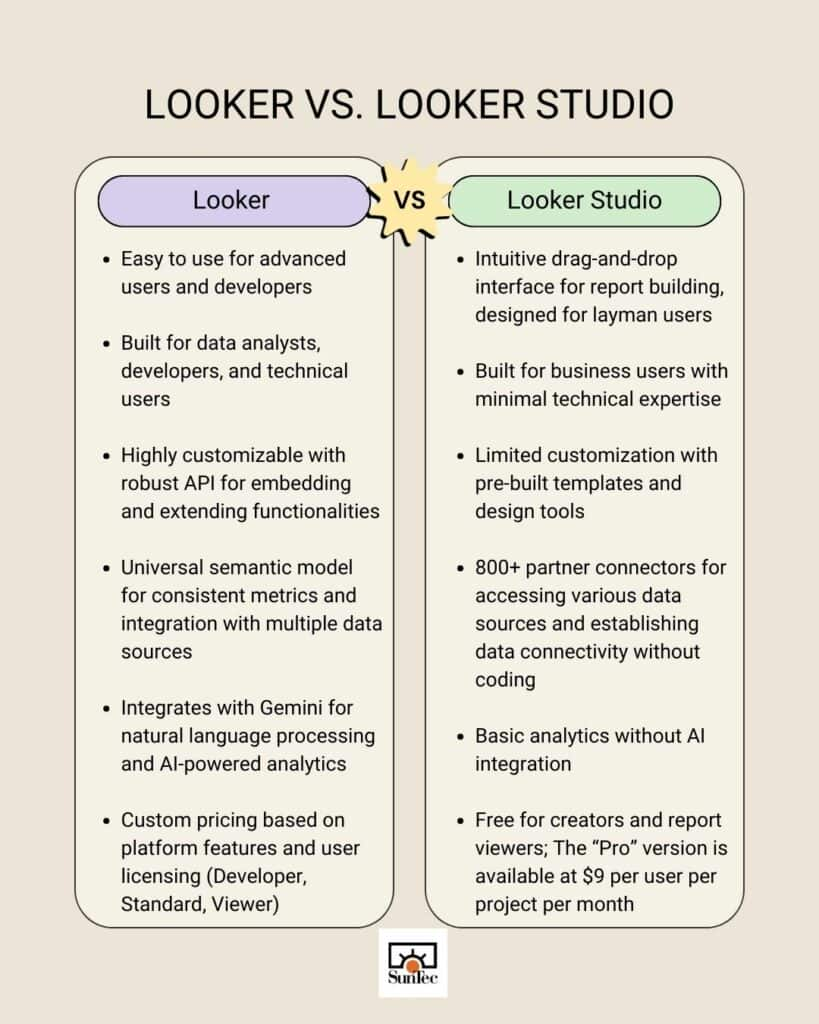
Looker Versus Looker Studio- Quick Comparison
While both Looker and Looker Studio are part of Google’s data analytics offerings, they serve different purposes and have different capabilities. Looker is primarily a data modeling and analytics platform with robust data governance, LookML for semantic modeling, and extensive integration capabilities. Looker Studio is focused on data visualization and reporting and is a more user-friendly and accessible tool for creating interactive and shareable dashboards.
Is Looker Better than Power BI or Tableau?
Answering this question with a simple ‘yes’ or ‘no’ would not do justice to the unique strengths each tool offers. Google’s Looker, Microsoft’s Power BI, and Salesforce’s Tableau are among the most powerful analytics and data visualization tools available today. Each one is embedded within a robust ecosystem and backed by the reputation of a leading enterprise known for its technological excellence. These tools are designed to meet diverse business needs, and their effectiveness depends on your specific requirements and context.
• Google Cloud’s Looker
It shines in cases where a company needs to create a unified view of business metrics across various data sources. It is a very strong semantic tool. Companies heavily using Google Cloud services can benefit from seamless integration.
Looker does have a steep learning curve, as it uses LookML, a proprietary modeling language, to define data models and relationships. Users need to learn LookML to fully utilize Looker’s capabilities, which can be challenging. Organizations with a technically skilled workforce can easily leverage LookML for advanced data modeling. However, smaller organizations with basic reporting needs may find Looker’s capabilities excessive.
• Microsoft Power BI
Businesses already invested in Microsoft products like Azure, SQL Server, and Office 365 should undoubtedly choose Power BI. However, companies not using the Microsoft ecosystem might not get the full value from its features.
It is also a decent choice for small to medium businesses looking for cost-effective BI solutions or for users who need an intuitive and easy-to-use tool with strong visualization capabilities. Organizations requiring very complex data modeling might find Power BI’s capabilities somewhat limited compared to Looker or Tableau.
• Salesforce’s Tableau
Tableau is best known for highly interactive and customizable visualizations. It also has flexible and powerful data handling capabilities suited for companies with complex data requirements. It will be wise to remember that Tableau has been reported to experience performance issues with very large datasets unless appropriately optimized.
Businesses with the budget to support a premium BI tool can consider Tableau and Looker. However, higher costs can be a barrier for smaller organizations. Users who wish to leverage advanced features and customizations also face a semi-steep learning curve.
Leverage Looker for Superior Business Intelligence
At the 2024 Google Cloud Next event, Google introduced conversational analytics with Gemini in Looker. This new feature revolutionizes the accessibility of insights for users, enabling seamless data engagement through natural language queries. Users will also be able to access other new capabilities for Looker that harness the power of generative AI, accelerating organizations’ ability to explore critical data. These enhancements empower users to quickly generate and share valuable insights, transforming their data analysis experience.
Google envisions Looker as a single source of truth for both modeled data and metrics that can be consumed across any of its products. For users, that means a simpler decision-making process and broader access to business intelligence. The sooner you hop on this wagon, the better for your organization!
The author can be consulted for any queries related to this article at info@odesk.me.
Source: suntecindia