Interpreting Covid-19 Test Results: A Bayesian Approach
In the early days of the Covid-19 pandemic, we were desperate to have a test — any test — to help sort out which patients with symptoms were infected with the coronavirus. Three months later, we face an entirely different problem: there is a bevy of tests — some for the virus, others for antibodies to the virus — and interpreting them has become increasingly confusing, to patients and clinicians alike.
With more testing and various versions of the two different types of tests, the confusion isn’t surprising. Last month’s “Can I fly?” or “Can I touch the mail?” questions have increasingly been replaced with questions like this: “My daughter tested positive, then negative, then…. What does that mean?”
While the tests themselves are confusing, partly because they are new and have wildly variable test characteristics, part of the problem is that patients and the media often lack some of the fundamental knowledge required to interpret any diagnostic test. Without this foundation, there is no good way to make sense of Covid-19 tests.
With this in mind, let’s do a brief tutorial on Covid-19 testing, with an emphasis on a Bayesian approach. After presenting the basics, we’ll walk through four confusing Covid-19 testing scenarios, just to give you a feel for the kinds of pickles we often find ourselves in.
Yes, there’s some math, but it’s still fun.
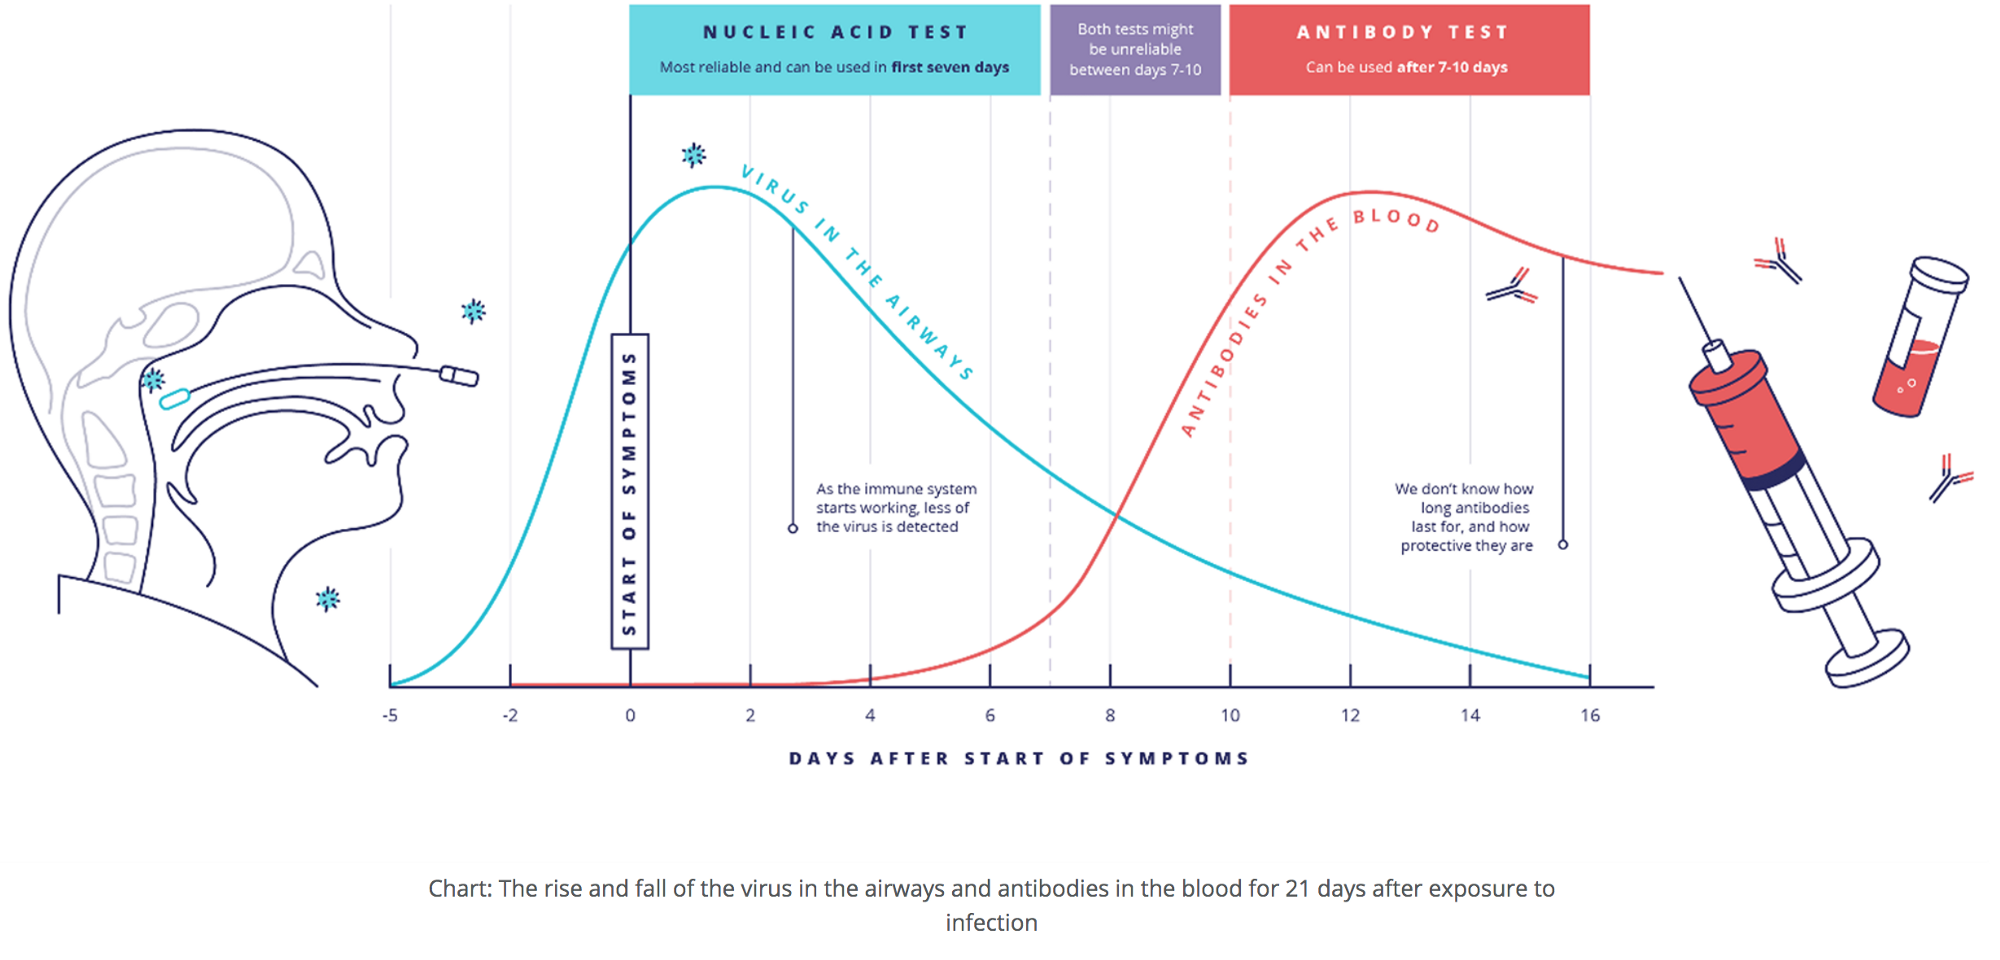
We won’t spend too much time reviewing the two major tests for Covid-19: viral vs. antibody tests. There are many good primers, such as this one from UK Research and Innovation. To interpret a test, it’s necessary to understand the differences between them (alas, the CDC seems to have forgotten this). One key to this understanding is the timing: do a viral test early, when one is showing symptoms or may have had high-risk exposure, and do an antibody test later, after the immune system has had time to build its defenses, in the form of antibodies, against the virus.

Even good primers (like the one from UKRI, which offers the table below as a way to help interpret positive or negative results in different situations) necessarily simplify test result interpretation: a positive test means X, a negative test means Y.
If only it were that simple.

There are many different kinds of medical tests that clinicians rely on to make accurate diagnoses: an x-ray or CT scan looking for a lesion consistent with cancer, an ECG looking for the ST-segment elevation or Q waves of a heart attack, pressing on the abdomen looking for the focal tenderness of appendicitis. In interpreting any medical test, it’s key to remember that no test is perfect. Some tests are close to perfect (an HIV test is a good example), but all tests can be wrong: they can be “negative” when someone actually does have the disease and “positive” when they, in fact, do not.
As we begin thinking about the accuracy of tests, there are two important terms to know: sensitivity and specificity.
1) Sensitivity = Positivity in Disease, or the proportion of people with a disease who have a positive test result. For example, if a treadmill stress test for coronary artery disease (CAD) has a sensitivity of 80%, 8/10 people with CAD who undergo the treadmill test will have a positive test. Those remaining 2 people, or 20% of patients with actual CAD, will have a “false negative” result.
2) Specificity = Negativity in Health, or the proportion of people who do not have the disease who have a negative test result. For example, if a test for antibodies to SARS-Cov-2 (the virus that causes Covid-19) is 99% specific, then 99/100 people who were never infected will have a negative antibodytest. The remaining person will receive a “false positive” result: the test says she has antibodies, but she truly doesn’t.

Enter Reverend Bayes, the 18th century British theologian and mathematician whose theorem is critical to diagnostic reasoning.
To interpret any test result, said Bayes, you must know two things: 1) How good is the test (i.e. how sensitive & how specific is it?), and 2) How likely was the person to have the disease before getting the test (sometimes called pretest probability)?
There are complex formulas and online calculators to help with the math (we like this diagnostic test calculator; use the second set of boxes). This can be a lot to digest, but here’s the bottom line: unless a test is always correct — 100% sensitive AND 100% specific — you will misinterpret the results unless you apply Bayesian reasoning.
So, let’s get to Covid-19 test results. We internists (like RMW) apply Bayesian reasoning about 50 times a day, but for newbies (and future internists like ZML), this can be wildly confusing. It’s also made worse by all sorts of Covid-specific head fakes: asymptomatic infections, viral vs. antibody tests, time and location dependency… the list goes on.
Let’s lay out stuff we know now about Covid-19 tests that influence the interpretation of results. It’s important to note that all three inputs that get plugged into the diagnostic test calculator (sensitivity, specificity, and prevalence) are nuanced and often require as much art as math.
To interpret Covid-19 tests, we need to consider several factors under two main categories: The Tests and The Patient.
1) The Tests (for determining sensitivity and specificity)
- Sensitivity and Specificity — these vary with individual tests but also vary with:
- The sampling method (for viral tests: nasal vs throat vs saliva each have different sensitivities)
- Handling of the samples (some false negatives occur because of specimen mishandling)
- Timing — Viral tests take a few days to turn positive; the virus needs enough time to replicate in the host’s cells to reach a level at which it can be detected, then will ultimately turn negative as the virus dies in the body, usually (but not always) about 10 days later. Antibody tests can take 1–2 weeks after infection to turn positive and will generally stay positive for many months, maybe forever
2) The Patient (for determining the prevalence; aka pre-test probability)
- Symptoms: there’s a higher chance of the patient having Covid-19 if there are flu-like symptoms (fever, aches, shortness of breath, cough) plus loss of taste or smell; a medium chance of infection if just flu-like symptoms; lowest chance of infection if asymptomatic
- Lab clues (e.g. having a low white blood cell count or characteristic chest imaging both raise the probability of Covid)
- Higher chance of Covid if known exposure to Covid-19 patient, whether or not the patient is symptomatic
- Higher chance of Covid-19 if the patient has been in an area of high prevalence (“hot-spot”)
- Higher chance of Covid if in a vulnerable group (working out of the house in a high-risk industry such as meatpacking; African-American or Latinx; resident of or working in a place where the virus is easily spread like nursing home, prison, homeless shelter)
With these factors in mind, let’s discuss four common and confusing testing scenarios.
First case: It’s March, 2020. A 40-year-old woman in San Francisco develops cough, fever/chills, body aches, and fatigue. Her friend in New York described similar symptoms that month and tested positive for Covid-19. Our patient thinks she too has Covid-19 and gets tested. Her viral PCR test comes back negative.
So what’s going on here? Why is our San Francisco patient’s Covid-19 test negative when her friend in New York with similar symptoms tested positive? How does Bayesian reasoning help us with the interpretation of her negative test result?
Let’s start with her symptoms, part of our “patient factors” discussed above. The symptoms of Covid-19 are non-specific; that is, they can be seen in many other viral infections, and even some non-viral illnesses. The only symptoms that make it more likely that the person actually has Covid-19 — meaning the only symptoms with any specificity for Covid — are the loss of taste and/or smell (see this paper in Nature for evidence, particularly Figure 1). All the other symptoms (fever, body aches, cough, shortness of breath, diarrhea) are a toss-up, meaning that these symptoms don’t really change the pre-test probability that the patient has Covid from those of other illnesses such as flu.
Since the prevalence of Covid has varied so much by location, we now need to think about where she’s coming from.(Note that the location wouldn’t have much salience if we were talking about a test for a heart attack or cancer. In these cases, our pre-test probability would be based much more on the symptoms, physical examination, and any relevant laboratory tests done so far.)
So let’s look at the prevalence of Covid-19 in these two different regions (San Francisco vs. New York) in March, 2020. And then, to make it clear that prevalence is a very dynamic variable in the setting of a pandemic (again, not so in diseases like cancer or heart disease), we’ll also consider the same scenarios had they happened in late-May. At UCSF, when we tested patients in March who told us they had “symptoms of Covid,” about 5% tested positive for SARS-CoV-2 (in the entire city of San Francisco, as we’ll see later, the number was a bit higher: 15% at it’s height). In contrast, at the height of the outbreak in New York City, 70% of viral tests for SARS-CoV-2 were positive: most people who thought they had symptoms of Covid were correct.
So, to correctly interpret our patient’s negative test result, we need to consider the pre-test probability — the chances that she has the disease before we did the test. To simplify things, let’s consider only three main variables to estimate the pre-test probability for Covid-19:
- Clinical presentation being more or less consistent with the disease (higher if she had flu symptoms plus loss of smell or taste)
- Prevalence in the community (higher in area with lots of Covid-19)
- Known exposure (higher if definite exposure)
Now we need to layer in the test factors and consider the fact that various viral tests vary in sensitivity. Remember the controversy over the rapid Abbott test used in the White House, after a study showed a sensitivity of about 50% (which is bad, remember, because that means that 50% of the tests in people with Covid would come back with negative results — false negatives). However, most of the tests used by national labs and hospitals have a sensitivity of about 70% — better, but still not perfect.
Let’s get back to our patient in SF and her friend in NYC, and their different test results. We’ll use real numbers to help us. For a viral PCR test, we’ll use the figures of 70% sensitive, 99.5% specific.
“Covid Symptoms” in New York City in mid-March:
[Prevalence 0.7 (70%), Sensitivity 0.7, Specificity 0.995, Sample size 1000]
So, a person with a positive test would have a >99% chance of having Covid.
The same person with a negative test would still have a 41% chance of having the disease. (Figure below — blue line is positive test, red is negative.)

Let’s look at the same patient, same symptoms, same test, but change the date to late-May, 2020:
[Prevalence 0.07 (7% testing positive in the community, down from 70% two months earlier), Sensitivity 0.7, Specificity 0.995 (same test), Sample size 1000]
Now, a person with a positive test would have a 91% chance of having Covid (9% are now false positives, up from 1% in March).
The same person with a negative test would have a 2% chance of having the disease (way down from 41%). Most clinicians would now reassure this person that she does not have Covid, something we could not have done with any level of confidence after a negative test in March.
Let’s now consider a patient with the same symptoms, same test, but in San Francisco in March:
[Prevalence 0.15 (about 15% of people with symptoms were testing positive in SF at our peak), Sensitivity 0.7, Specificity 0.995, Sample size 1000]
Now, a person with a positive test would have a 96% chance of having Covid-19.
The same person with a negative test would have a 5% chance of having the disease.
Same patient, same test, but now applying it in San Francisco in late-May, with an even-lower prevalence:
[Prevalence 0.03 (today ~3% of patients with symptoms test positive), Sensitivity 0.7, Specificity 0.995, Sample size 1000]
So, this person with a positive test would have an 81% chance of having Covid-19 (because the prevalence is so low, even a very specific test like the viral PCR has a fair chance of leading to a false positive result).
The same person with a negative test would have a 1% chance of having the disease.
So the bottom line is this: for two patients with precisely the same symptoms and taking precisely the same test, a negative test in San Francisco would have given her a 5% chance of having Covid-19 in March and a 1% in late-May. If she had been in New York, the same negative test in March would have left her with a 41% chance of having Covid-19; by late-May, the chance would have fallen to 2%, a massive difference.
What to do with our patient’s negative tests, then. For three of the four results (all except for the test in New York in March), we would recommend giving the patient a clean bill of health, telling her that she doesn’t have Covid-19 (although with flu symptoms, it’s still prudent for her to stay home and keep away from people). This is because a 1–5% chance is low enough that we will generally just call it negative. (For Bayesian aficionados, we would say that the post-test odds are below the testing threshold; this threshold varies with the availability/risk/cost of an alternative test and the consequences of missing a diagnosis, which, for a mild case of Covid, aren’t super-high.)
Had her friend tested negative in New York in March, though, it would be prudent to tell her that — though her test was negative — there was still a pretty good chance (41%) that she has Covid-19. She should go home and stay isolated, and return in 2–3 days for a repeat test.
Second case: A 65-year-old man was diagnosed with Covid-19 three weeks ago based on a positive viral PCR test. He is required to have a negative test to return to work, but a second test, taken 16 days into his illness, is still positive. He is still a bit achy but mostly feels better.
This is a common and vexing scenario. Studies, such as this Singapore study, have confirmed that Covid-19 patients are no longer infectious ~11 days after illness began. Cases of persistent viral PCR positivity are the result of the test detecting dead virus, no longer capable of transmission.
If this man truly was infected with SARS-CoV-2 three weeks ago, then getting an antibody test might be helpful to confirm this and clear him to go back to work. Scientists are working on new tests looking for live virus, which would help sort out these confusing situations, but they’re not quite ready yet.
Which brings us to our third case and discussion of the antibody test (also known as serology testing).
Third case: A 26-year-old woman has a positive SARS-Cov-2 antibody test, done as part of screening program at work. She is surprised because she doesn’t recall any symptoms in the prior three months.
How do we interpret her antibody test results? Let’s say that this patient, like our patient from the first case, is in low-prevalence San Francisco, which means that there is a high chance that her test result is a false positive (because the prevalence of Covid-19 is so low, about 1%). Antibody testing introduces its own twists and turns and it is crucial to channel the Reverend Bayes to make the right call about her test.
(A side note: when it came to assessing Covid testing, while the FDA was restrictive in approving viral tests, they were much more permissive when it came to antibody testing. The result? A lot of variation in the test performance of antibody tests. So it’s important to know which particular test is being used, to be able to plug accurate sensitivity and specificity numbers into the Bayesian calculator.)
Let’s say that this particular antibody test is 80% sensitive, meaning it picks up antibodies in 4/5 people who have had a prior Covid-19 infection. And, let’s say it is a very specific test: 99% specific (so there is only one false positive in 100 tests). By the way, now that we appreciate that 35–40% of Covid-19 patients have no symptoms during their entire illness, the lack of symptoms doesn’t lower her probability of having Covid-19 very much.
Because our patient is in San Francisco, with prevalence rates in asymptomatic people well under 1% (let’s use 0.5% here), we’ll quickly discover that most positives represent false positives:
Let’s use these numbers for an antibody test done in San Francisco in late-May: [Prevalence of 0.5%, 80% sensitive, 99% specific. Plugging in these numbers to the Bayesian calculator gives us a positive predictive value of 29%, and a negative predictive value of ~0%.] So our patient’s positive antibody test has a 71% chance of being a false positive.Telling her that she “has antibodies to Covid” is more likely to be wrong than right, a potentially serious mistake if she gets lax about mask-wearing and/or distancing, or she tries to donate convalescent plasma.
Alternatively, if the patient were in high-prevalence New York City in March, it’s very likely that this patient’s positive test result would represent a true prior infection. Here’s the calculation:
Let’s use these numbers for NYC:[Prevalence of 15% (about 15–20% of New Yorkers have antibodies to SARS-CoV-2, a result of the tsunami of infections that swept through the city in March and April), 80% sensitivity, 99% specificity (same test as above).]When we plug these into our Bayesian calculator, we find that 93% of positives are true positives, and people with negative tests have a 3% chance of truly having antibodies (false negatives).Note that 7% of people “with antibodies” (according to the test) don’t actually have them. This, coupled with the fact that we are not sure if antibodies are protective, means that such people should not make the assumption that they are immune to Covid.
Note that the “pre-test probability” refers to the chances the patient has the disease you’re testing for right before you do a given test. It can change as a result of any new information, including the results of prior tests. Let’s work that through with antibody testing in a patient with a prior viral test. Here, we’ll see that the results of one test (a viral test) influence the math we use for a subsequent test (an antibody test). Because probabilities can piggyback on one another, each new data point — prior tests, the patient’s course, what’s happening in the community — shifts the odds.
Fourth Case: A patient in San Francisco had a positive PCR test in April and now has a positive antibody test in late-May. She has never had any symptoms of Covid.
Remember Case 3 — in San Francisco, with its low prevalence, there is a good chance that a positive antibody test is a false positive… if that’s the only information you have. But if the patient previously had a positive viral test, the pre-test probability is higher, and so is the believability of a positive antibody test.
Here’s the math: The prevalence of the virus in an asymptomatic patient in San Francisco is 0.3%. The PCR is 70% sensitive and about 99.5% specific. So, if she had a positive test, her chances of having Covid-19 have gone up to about 30% — there’s still a 70% chance of a false positive, given the low prevalence in the community, but her chances have gone up from 1/300 (0.3% prevalence) to about 1/3.
Now she is going to have an antibody test. Her pre-test probability is now 30%, having gone up substantially because of her positive PCR. Let’s apply that 30% probability, and use antibody test characteristics of 80% sensitivity and 99% specificity. Now, rather than a positive antibody test having a 29% chance of being right, a positive test would have a 97% chance of being a true positive. She truly had Covid-19 and now has antibodies.
In the case of Covid-19 testing, as time goes on and the science matures, all these odds will become more precise: the pre-test estimate of prevalence will come from up-to-date prevalence data in a given zip code (and maybe from monitoring an area’s sewage), and we’ll have a better handle on which symptoms and prior test results make it more or less likely that a given patient has or had Covid-19. For antibodies, we’ll also get a better understanding of test characteristics and hopefully the performance of the tests will improve.
Bayesian reasoning is among the most fascinating topics in medicine, and it’s absolutely essential to unraveling the evolving mysteries of Covid-19 testing. It is also key to interpreting other tests, like political polls, as Nate Silver knows.
Source: medium


