


Monitoring Microservice Application on AWS EKS with Prometheus and Grafana
Monitoring is key for understanding your application performance, availability, and potential bottleneck. With Prometheus and Grafana you can monitor your infrastructure performance, resource usage, and overall health of your EKS cluster. In this guide, you’ll learn how to monitor a microservice Kubernetes cluster metrics and visualize Data.
Pre-requisite
Ensure the following prerequisites are in place before starting
- AWS CLI, eksctl, kubectl, and Helm are installed and configured.
- AWS IAM permissions to create and manage EKS clusters.
- Basic knowledge of Kubernetes and Helm for application deployment.
Table of content:
- Create EKS cluster
- Create Microservice App
- Set Up Helm and Add Repositories
- Create a Namespace for Monitoring
- Install Prometheus and Grafana using Helm
- Accessing Prometheus and Grafana Dashboards
Step 1: Create EKS cluster
To begin, create a Kubernetes cluster on AWS using eksctl. This command will create a managed EKS cluster with 2–3 t3.medium nodes
eksctl create cluster --name=eks-cluster --region=ap-south-1 --version=1.29 --nodegroup-name=my-nodes --node-type=t3.medium --managed --nodes=2 --nodes-min=2 --nodes-max=3Breakdown
name: The name of your EKS cluster.region: The AWS region to deploy the cluster.nodegroup-name: The name of the node group.node-type: The EC2 instance type for nodes.nodes:Number of initial nodes.nodes-min & nodes-max: Minimum and maximum node count for scaling.
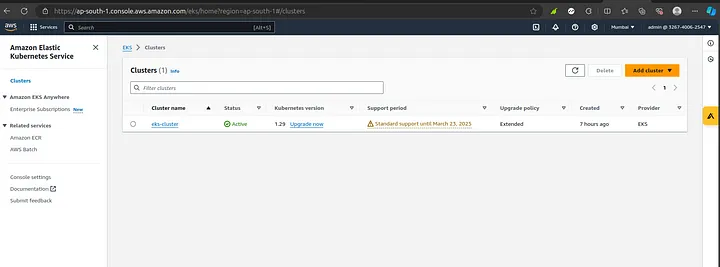
Kindly note the command above will take approximately 10–20 minutes to complete, depending on your network speed. Once it’s finished, you can go to your AWS console to view the newly created EKS cluster
Once the cluster is created, confirm its status by listing your clusters
eksctl get cluster --name eks-cluster --region ap-south-1
Configure kubectl to connect to the newly created cluster
aws eks update-kubeconfig --name eks-cluster --region ap-south-1check the nodes in the cluster
kubectl get node
Step 2 – Create microservice App
In this section, we’ll set up a microservice application in the Eks cluster we previously created. we will be using the google demo microservice project. At the end of this section, you will have a working microservice application running in your EKS environment.
Create a file called config.microservice.yaml
apiVersion: apps/v1
kind: Deployment
metadata:
  name: emailservice
spec:
  selector:
    matchLabels:
      app: emailservice
  template:
    metadata:
      labels:
        app: emailservice
    spec:
      containers:
        - name: server
          image: gcr.io/google-samples/microservices-demo/emailservice:v0.3.0
          ports:
            - containerPort: 8080
          env:
            - name: PORT
              value: "8080"
---
apiVersion: v1
kind: Service
metadata:
  name: emailservice
spec:
  type: ClusterIP
  selector:
    app: emailservice
  ports:
    - protocol: TCP
      port: 5000
      targetPort: 8080

---
apiVersion: apps/v1
kind: Deployment
metadata:
  name: recommendationservice
spec:
  selector:
    matchLabels:
      app: recommendationservice
  template:
    metadata:
      labels:
        app: recommendationservice
    spec:
      containers:
        - name: server
          image: gcr.io/google-samples/microservices-demo/recommendationservice:v0.3.0
          ports:
            - containerPort: 8080
          env:
            - name: PORT
              value: "8080"
            - name: PRODUCT_CATALOG_SERVICE_ADDR
              value: "productcatalogservice:3550"
---
apiVersion: v1
kind: Service
metadata:
  name: recommendationservice
spec:
  type: ClusterIP
  selector:
    app: recommendationservice
  ports:
    - protocol: TCP
      port: 8080
      targetPort: 8080

---
apiVersion: apps/v1
kind: Deployment
metadata:
  name: paymentservice
spec:
  selector:
    matchLabels:
      app: paymentservice
  template:
    metadata:
      labels:
        app: paymentservice
    spec:
      containers:
        - name: server
          image: gcr.io/google-samples/microservices-demo/paymentservice:v0.3.0
          ports:
            - containerPort: 50051
          env:
            - name: PORT
              value: "50051"
---
apiVersion: v1
kind: Service
metadata:
  name: paymentservice
spec:
  type: ClusterIP
  selector:
    app: paymentservice
  ports:
    - protocol: TCP
      port: 50051
      targetPort: 50051

---
apiVersion: apps/v1
kind: Deployment
metadata:
  name: productcatalogservice
spec:
  selector:
    matchLabels:
      app: productcatalogservice
  template:
    metadata:
      labels:
        app: productcatalogservice
    spec:
      containers:
        - name: server
          image: gcr.io/google-samples/microservices-demo/productcatalogservice:v0.3.0
          ports:
            - containerPort: 3550
          env:
            - name: PORT
              value: "3550"
---
apiVersion: v1
kind: Service
metadata:
  name: productcatalogservice
spec:
  type: ClusterIP
  selector:
    app: productcatalogservice
  ports:
    - protocol: TCP
      port: 3550
      targetPort: 3550

---
apiVersion: apps/v1
kind: Deployment
metadata:
  name: currencyservice
spec:
  selector:
    matchLabels:
      app: currencyservice
  template:
    metadata:
      labels:
        app: currencyservice
    spec:
      containers:
        - name: server
          image: gcr.io/google-samples/microservices-demo/currencyservice:v0.3.0
          ports:
            - containerPort: 7000
          env:
            - name: PORT
              value: "7000"
---
apiVersion: v1
kind: Service
metadata:
  name: currencyservice
spec:
  type: ClusterIP
  selector:
    app: currencyservice
  ports:
    - protocol: TCP
      port: 7000
      targetPort: 7000

---
apiVersion: apps/v1
kind: Deployment
metadata:
  name: shippingservice
spec:
  selector:
    matchLabels:
      app: shippingservice
  template:
    metadata:
      labels:
        app: shippingservice
    spec:
      containers:
        - name: server
          image: gcr.io/google-samples/microservices-demo/shippingservice:v0.3.0
          ports:
            - containerPort: 50051
          env:
            - name: PORT
              value: "50051"
---
apiVersion: v1
kind: Service
metadata:
  name: shippingservice
spec:
  type: ClusterIP
  selector:
    app: shippingservice
  ports:
    - protocol: TCP
      port: 50051
      targetPort: 50051

---
apiVersion: apps/v1
kind: Deployment
metadata:
  name: adservice
spec:
  selector:
    matchLabels:
      app: adservice
  template:
    metadata:
      labels:
        app: adservice
    spec:
      containers:
        - name: server
          image: gcr.io/google-samples/microservices-demo/adservice:v0.3.6
          ports:
            - containerPort: 9555
          env:
            - name: PORT
              value: "9555"
---
apiVersion: v1
kind: Service
metadata:
  name: adservice
spec:
  type: ClusterIP
  selector:
    app: adservice
  ports:
    - protocol: TCP
      port: 9555
      targetPort: 9555

---
apiVersion: apps/v1
kind: Deployment
metadata:
  name: cartservice
spec:
  selector:
    matchLabels:
      app: cartservice
  template:
    metadata:
      labels:
        app: cartservice
    spec:
      containers:
        - name: server
          image: gcr.io/google-samples/microservices-demo/cartservice:v0.3.0
          ports:
            - containerPort: 7070
          env:
            - name: REDIS_ADDR
              value: "redis-cart:6379"
---
apiVersion: v1
kind: Service
metadata:
  name: cartservice
spec:
  type: ClusterIP
  selector:
    app: cartservice
  ports:
    - protocol: TCP
      port: 7070
      targetPort: 7070

---
apiVersion: apps/v1
kind: Deployment
metadata:
  name: checkoutservice
spec:
  selector:
    matchLabels:
      app: checkoutservice
  template:
    metadata:
      labels:
        app: checkoutservice
    spec:
      containers:
        - name: server
          image: gcr.io/google-samples/microservices-demo/checkoutservice:v0.3.0
          ports:
            - containerPort: 5050
          env:
            - name: PORT
              value: "5050"
            - name: PRODUCT_CATALOG_SERVICE_ADDR
              value: "productcatalogservice:3550"
            - name: SHIPPING_SERVICE_ADDR
              value: "shippingservice:50051"
            - name: PAYMENT_SERVICE_ADDR
              value: "paymentservice:50051"
            - name: EMAIL_SERVICE_ADDR
              value: "emailservice:5000"
            - name: CURRENCY_SERVICE_ADDR
              value: "currencyservice:7000"
            - name: CART_SERVICE_ADDR
              value: "cartservice:7070"
---
apiVersion: v1
kind: Service
metadata:
  name: checkoutservice
spec:
  type: ClusterIP
  selector:
    app: checkoutservice
  ports:
    - protocol: TCP
      port: 5050
      targetPort: 5050

---
apiVersion: apps/v1
kind: Deployment
metadata:
  name: frontend
spec:
  selector:
    matchLabels:
      app: frontend
  template:
    metadata:
      labels:
        app: frontend
    spec:
      containers:
        - name: server
          image: gcr.io/google-samples/microservices-demo/frontend:v0.3.0
          ports:
            - containerPort: 8080
          env:
            - name: PORT
              value: "8080"
            - name: PRODUCT_CATALOG_SERVICE_ADDR
              value: "productcatalogservice:3550"
            - name: CURRENCY_SERVICE_ADDR
              value: "currencyservice:7000"
            - name: CART_SERVICE_ADDR
              value: "cartservice:7070"
            - name: RECOMMENDATION_SERVICE_ADDR
              value: "recommendationservice:8080"
            - name: SHIPPING_SERVICE_ADDR
              value: "shippingservice:50051"
            - name: CHECKOUT_SERVICE_ADDR
              value: "checkoutservice:5050"
            - name: AD_SERVICE_ADDR
              value: "adservice:9555"
---
apiVersion: v1
kind: Service
metadata:
  name: frontend
spec:
  type: ClusterIP
  selector:
    app: frontend
  ports:
    - name: http
      port: 80
      targetPort: 8080
---
This configuration file defines multiple Kubernetes Deployments and Services to set up a microservices application using Google’s demo application. Each microservice runs in its own container and is exposed through a Kubernetes Service for internal communication. This setup ensure we can monitor each service, its interactions and overall performance with the cluster.
Apply the configuration
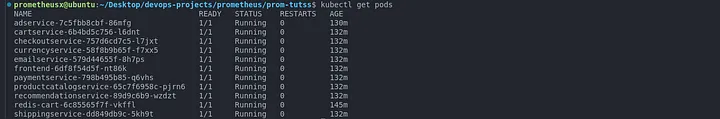
kubectl apply -f config-microservices.yamlCheck if pods running
kubectl get pods
Step 3 – Set Up Helm and Add Repositories
In this section, we will set up Helm, a Kubernetes package manager, simplifying the deployment and management of applications in your cluster. Prometheus and Grafana have Helm charts available in the Prometheus community repository, which simplifies installation.
Add helm Stable chart for your local repository
helm repo add stable https://charts.helm.sh/stableAdd Prometheus Community Repository
helm repo add prometheus-community https://prometheus-community.github.io/helm-chartsUpdate Helm Repositories
helm repo updateStep 4 — Create a Namespace for Monitoring
We will create a dedicated namespace called monitoring to manage our monitoring components (Prometheus, grafana)
kubectl create namespace monitoring
kubectl get ns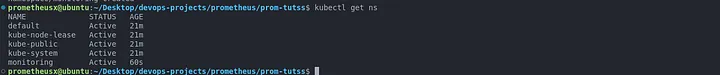
Step 5: Install Prometheus and Grafana using Helm
With Helm and the Prometheus community repository configured, we can install the kube-prometheus-stack, which includes both Prometheus and Grafana and other tools for monitoring Kubernetes.
helm install monitoring prometheus-community/kube-prometheus-stack -n monitoringVerify that the Prometheus and Grafana pods are running
kubectl get pods -n monitoringCheck the services created by the Prometheus-Grafana stack
kubectl get svc -n monitoringStep 6: Accessing Prometheus and Grafana Dashboards
Prometheus: To access the Prometheus dashboard locally, use port forwarding
kubectl port-forward service/monitoring-kube-prometheus -n monitoring 9090:9090 &

Once port-forwarding is active, you can access the Prometheus dashboard in your browser at http://localhost:9090.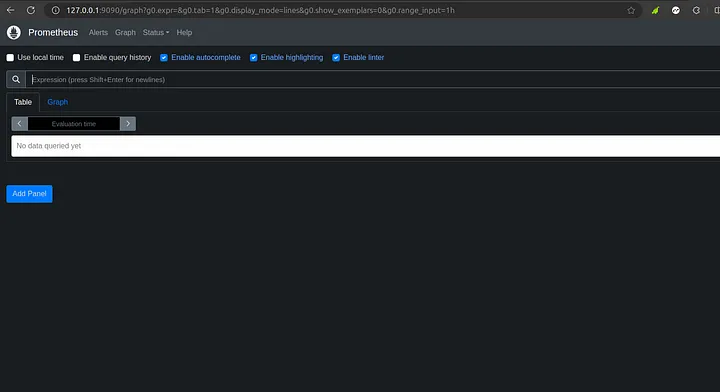
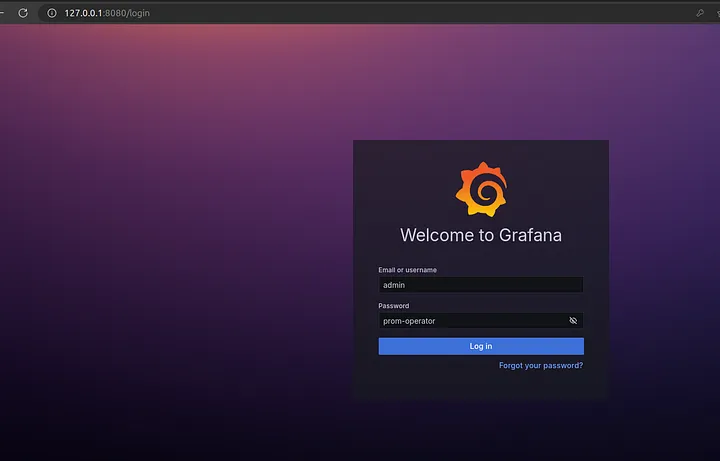
Grafana: Similarly, access Grafana by forwarding port 80 of the Grafana service to a local port 8080.
kubectl port-forward service/monitoring-grafana 8080:80 -n monitoring &Open your browser and go to http://localhost:8080. The default login credentials for Grafana are:
Username: admin
Password: prom-operator
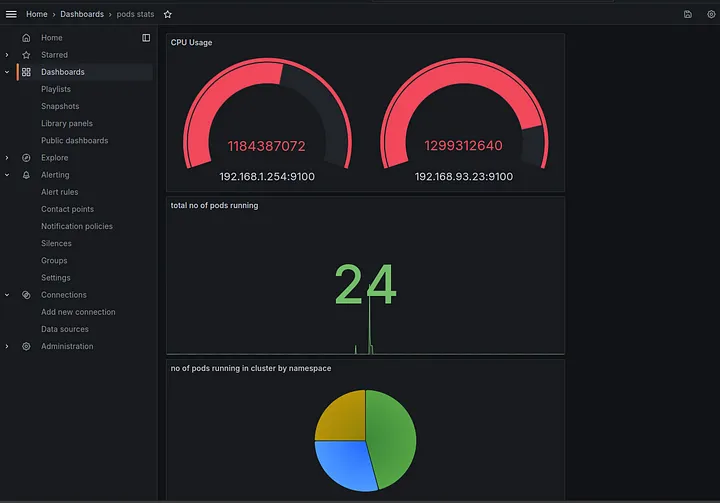
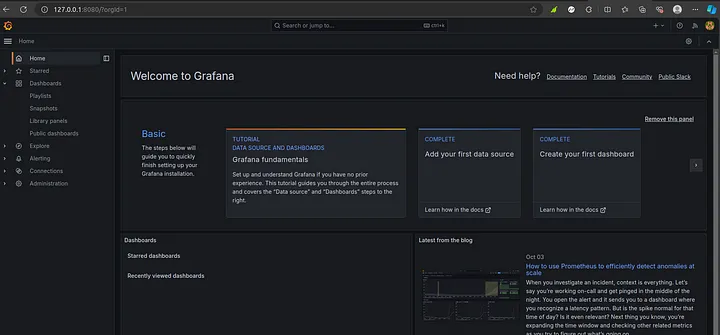
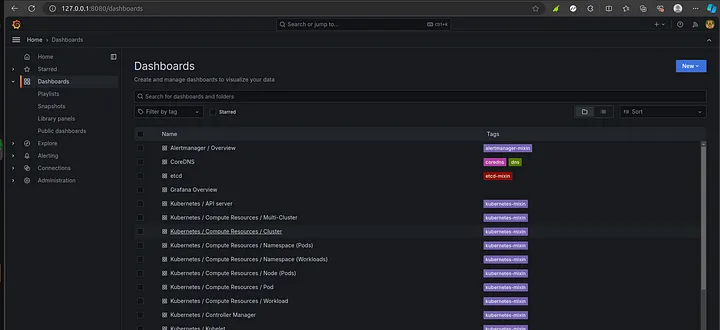
Grafana homepage
Manage Dashboard
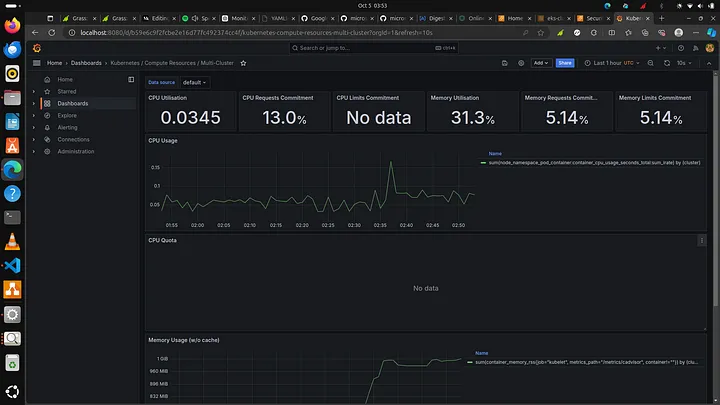
CPU usage on the kubernetes cluster
Step 7 — Delete cluster
Run the command below
eksctl delete cluster --name eks-clusterYou have successfully set up monitoring for your Kubernetes microservices on AWS EKS using Prometheus and Grafana! This setup allows you to gain insights into your application’s performance and health, helping you to ensure smooth operations and quick troubleshooting.