

The Challenge of Linux Resource Diagnosis
Diagnosing system degradation in high-throughput Linux production environments requires low-level visibility across compute, storage, and memory subsystems. When an application experiences latency spikes or unresponsive worker threads, system administrators and Site Reliability Engineers (SREs) encounter several operational challenges:
- Resource Isolation Blind Spots: High-level tools like top or htop aggregate system utilization but often mask per-core CPU imbalances or individual thread-level starvation.
- I/O Saturation Masking: High CPU wait times (%iowait) indicate disk bottlenecks, but identifying whether a specific block device or a specific process is driving storage queue saturation requires dedicated metrics.
- Lack of Historical Context: Transient performance degradation that occurs during off-peak hours or automated maintenance windows cannot be diagnosed after the event without continuous background telemetry recording.
- High Profiling Overhead: Invoking heavy tracing frameworks during active production incidents can worsen CPU contention or trigger kernel panics.
The Sysstat utility suite resolves these operational liabilities by providing a lightweight, low-overhead set of command-line utilities for both real-time system inspection and automated historical data logging.
What Is the Sysstat Performance Monitoring Suite?
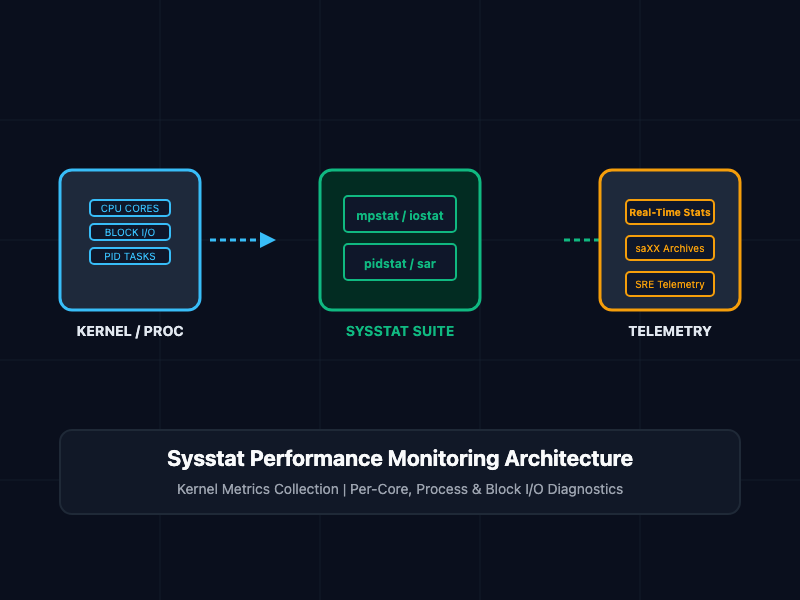
Sysstat is an open-source collection of performance monitoring tools for Linux operating systems. Designed for minimal CPU and memory overhead, Sysstat interfaces directly with Linux kernel pseudo-filesystems (/proc and /sys) to collect, display, and archive performance statistics.
The core utilities comprising the Sysstat package include:
- mpstat (Multi-Processor Statistics): Displays CPU utilization metrics broken down by individual CPU cores, thread hardware, or NUMA nodes.
- pidstat (Process-Level Statistics): Monitors resource consumption—including CPU, memory, page faults, and disk I/O—isolated to specific Process IDs (PIDs) or tasks.
- iostat (Input/Output Statistics): Reports storage device utilization, throughput MB/s, read/write IOPS, and average queue latency across physical disks and partitions.
- sar (System Activity Reporter): Collects, displays, and archives historical system activity data across CPU, memory, swap, network interfaces, and kernel tables.
Core Commands and Implementation
1. Analyzing Per-Core CPU Imbalance with mpstat
Standard aggregate CPU meters hide single-core bottlenecks. The mpstat utility isolates processing loads across every CPU core, highlighting thread affinity issues or unequal interrupt distribution (%irq and %soft).
To monitor all CPU cores individually at 2-second intervals for 5 iterations:
# Execute mpstat with per-core breakdown (-P ALL)
mpstat -P ALL 2 5
Sample output analysis:
Linux 6.8.0-31-generic (srv-prod-api-01) 	08/18/2026 	_x86_64_	(8 CPU)

04:15:02 PM  CPU    %usr   %nice    %sys %iowait   %irq  %soft  %steal  %guest  %gnice   %idle
04:15:04 PM  all   12.50    0.00    3.12    1.25   0.00   0.62    0.00    0.00    0.00   82.51
04:15:04 PM    0   98.00    0.00    2.00    0.00   0.00   0.00    0.00    0.00    0.00    0.00
04:15:04 PM    1    2.10    0.00    0.50    0.00   0.00   0.00    0.00    0.00    0.00   97.40
Key Parameter Analysis: Core 0 is saturated at 98.00% user utilization (%usr), while Core 1 is virtually idle (97.40% idle). This pattern reveals a single-threaded application bottleneck or incorrect process thread affinity.
2. Pinpointing Process Resource Consumption with pidstat
While mpstat flags hardware-level saturation, pidstat identifies the exact executable or process ID driving the load.
To monitor process disk I/O statistics at 3-second intervals for active tasks:
# Monitor process disk I/O metrics (-d) for active processes
pidstat -d 3 3
To monitor process-level CPU consumption alongside thread-level granularity (-t):
# Display CPU stats (-u) including child threads (-t) for PID matching "postgres"
pidstat -u -t -C "postgres" 2 2
Sample I/O output analysis:
04:20:10 PM   UID       PID   kB_rd/s   kB_wr/s kB_ccwr/s iodelay  Command
04:20:13 PM  1001     14092   45120.00  12400.00    512.00      12  node
04:20:13 PM   999     18921      0.00  89200.00      0.00       2  postgres
Key Metrics: kB_rd/s and kB_wr/s report exact kilobytes read and written per second by each process, isolating disk saturation to specific commands.
3. Storage Subsystem and Block Device Diagnostics with iostat
The iostat command evaluates storage device throughput, device queue lengths, and service times. This isolates physical disk limits from application software bugs.
Execute an extended iostat report in human-readable megabytes (-m), showing device timestamps (-t) and extended statistics (-x):
# Display extended I/O statistics in MB/s with device timestamps
iostat -x -m -t 2 3
Sample output analysis:
Device            r/s     w/s     rMB/s     wMB/s   rrqm/s   wrqm/s  r_await  w_await aqu-sz  %util
nvme0n1        450.00  1200.00    18.00     48.00     0.00    12.00     1.20    15.40   8.50  98.20
sda              2.00     5.00     0.05      0.12     0.00     0.00     0.50     1.10   0.01   0.80
Critical Indicators:
- %util: Percentage of elapsed time during which I/O requests were issued to the device. Values near 100% indicate storage saturation.
- aqu-sz: Average queue length of requests issued to the block device. An escalating aqu-sz paired with high %util confirms an I/O bottleneck.
- r_await / w_await: Average time (in milliseconds) for read and write requests to be served.
4. Historical Telemetry and Trend Analysis with sar
The sar (System Activity Reporter) utility allows SREs to inspect historical performance data collected automatically by the background sysstat daemon (sysstat.service or sar.service).
To inspect historical CPU utilization recorded earlier in the current day:
# Display historical CPU utilization statistics for the current day
sar -u
To inspect historical network interface traffic stats for a specific day using a Sysstat binary data file:
# Query network interface statistics (-n DEV) from the 15th day of the month file
sar -n DEV -f /var/log/sysstat/sa15
Comparative Utility Matrix
Review the primary scope and target use cases for each tool in the Sysstat suite:
| Utility | Primary Inspection Scope | Key Metric Focus | Typical Production Use Case |
|---|---|---|---|
| mpstat | Processor & Core Architecture | %usr, %sys, %iowait, %idle | Diagnosing CPU thread imbalance & NUMA load |
| pidstat | Individual Process / PID Tasks | kB_rd/s, kB_wr/s, %CPU, VSZ | Identifying resource-hogging container tasks |
| iostat | Storage Block Devices & Partitions | IOPS, MB/s, aqu-sz, %util | Detecting NVMe/SSD physical saturation |
| sar | Historical Whole-System Baseline | CPU, Memory, Network, Swap, Context Swaps | Post-incident root cause analysis (RCA) |
SRE and Production Best Practices
- Enable the Sysstat Background Collector Service: Ensure the sysstat systemd service is active and enabled at boot to collect historical /var/log/sysstat/saXX files for post-incident analysis.
- Adjust Sampling Frequency for High-Density Systems: Update /etc/cron.d/sysstat or the systemd timer configuration (sysstat-collect.timer) to poll every 1 to 5 minutes instead of the default 10-minute interval during active incident periods.
- Combine iostat with pidstat During High %iowait Alerts: When an alert fires for high %iowait, run iostat -x 2 to identify the saturated block device (nvme0n1), followed immediately by pidstat -d 2 to catch the offending PID.
- Audit Theft Time (%steal) in Virtualized Cloud Environments: Monitor the %steal column in mpstat or sar -u on AWS EC2 or cloud VMs. A high %steal value indicates hypervisor CPU oversubscription by the cloud provider.
Getting Started
To install and initialize the Sysstat suite across primary Linux distributions:
# Ubuntu / Debian Installation
sudo apt update && sudo apt install -y sysstat

# RHEL / Rocky Linux / AlmaLinux Installation
sudo dnf install -y sysstat

# Enable and start background historical data collection daemon
sudo systemctl enable --now sysstat
sudo systemctl status sysstat

# Verify local installation by executing a real-time 1-second system check
sar -u 1 3
By mastering mpstat, pidstat, iostat, and sar, system administrators and SREs establish a complete, lightweight diagnostic framework for resolving production performance bottlenecks across CPU, process, disk, and historical metrics.